
Overview:
- Knowledge is power
- Marketing Analytics KPIs
- What to Measure on Social Media
- Which Website Analytics to Watch
- What to Measure with Email Marketing
- Which Advertising Analytics to Track
- Proactive Data Collection
For any marketing campaign to be successful, you must know what success is.
That brings us to a fundamental concept in any business: “know your numbers.”
Know Your Starting Point
You simply can’t measure your progress if you don’t know where you started.
It’s impossible to say we had a 75% increase if you don’t know your starting statistics. It’s also impossible to set clear and measurable goals without knowing where you began.
If you want 10,000 website visits a day, you need to know if you’re currently getting 10 or 5,000 visits each day in order to understand what it will take and how feasible that goal really is.
“Today it’s not about ‘get the traffic’ – it’s about ‘get the targeted and relevant traffic.’”
– Adam Audette
So, we recommend companies start by simply looking over their website, social media, email marketing, and advertising platforms to collect basic statistics before they start making any changes or setting any digital marketing goals. Keep reading to learn what to look for…
Know Your Company Goals
 Your marketing goals should be derived from your business goals.
For example, if you have a business goal of increasing membership sales, you may not have a marketing goal hyper-focused on Facebook page likes. Once you know where you’re starting from and have identified company initiatives, you can create SMART goals and break them down into action steps and a plan for the quarter and the year.
Remember, without goals, there’s no real measure of whether you’ve been successful – just an arbitrary measure of increase or decrease that may or may not drive progress.
KPIs, Key Performance Indicators
There’s a lot of data out there that can look impressive.
Anyone that’s spent a lot of time around stats knows that you can usually find something that looks positive. But if you really want to measure your data successfully, you should identify what’s important and then compare these measurements over time.
Some of the key measurements to watch are:
- cost per click (CPC)
- click through rate (CTR)
- cost per result or conversion
- return on investment (ROI) or return on advertising spend (ROAS)
CPC: amount spent/number of clicks. This refers to the amount it costs you to get someone to click on your link and see your offer or content.
CTR: number of impressions/number of clicks. This measurement gives you a view of the percentage of people that are clicking on your content.
Cost Per Conversion: amount spent/number of conversions. This refers to the amount it costs you to accomplish the goal you set. Your goal could be a variety of options, such as page views, downloads, opt-ins, event registrations, purchases, engagement, appointments, etc.
ROAS: revenue generated – advertising budget. This measurement simply states how much profit you generated after factoring in your ad spend costs.
ROI: revenue generated – campaign costs. This is another option, in this version you can add other costs in addition to ad spend, in order to calculate the overall profit of your campaign.
Spotlight on Social Media Engagement
Most anyone knows social media is huge. For instance, just consider these mind-boggling stats on Facebook:
- 69% of U.S. adults use Facebook.
- More than 8 billion people use Facebook Groups every month.
- 1 billion Facebook Stories are shared daily.
- 400 users sign up on Facebook every minute.
- 6% of all social media users use FB.
It’s important to watch your following as well as your engagement on social media.
Engagement can include clicks, likes, comments, and shares. Watching these statistics will help you identify what your audience will respond to. Keep an eye on image trends, content trends, and themes to help you determine where to spend your time and money going forward.
For suggestions on how to turn followers into paying customers: https://woocommerce.com/posts/turn-social-media-followers-ecommerce-sales/
Who Visits Your Website & Where Is Traffic Coming From?
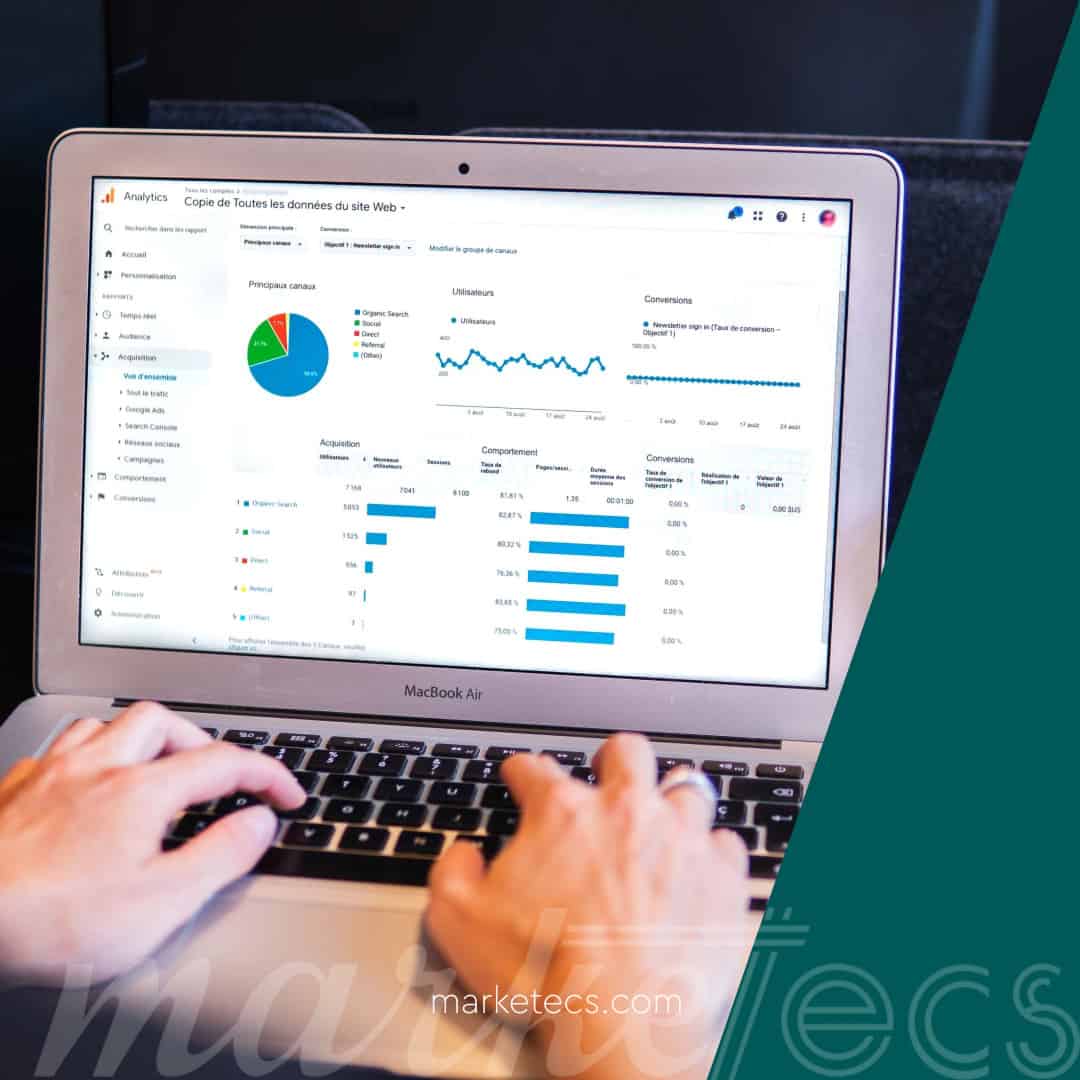 On your website, overall traffic is the first measurement.
Next, you will want to watch the most frequently visited pages and where your traffic is coming from. These indicators will help you identify content categories and where to spend your energy attracting new traffic that will yield the most rewards.
With an analytics tool, you can review conversion trends, the customer path when on your site, and even individual page heat maps. Some of these measurements will require more detailed reporting via Google Analytics or even some added programs, but they can be very helpful in optimizing your pages and content for improved conversions.
There are several free and paid website analytics tools available, Google Analytics being one of the most popular. Here are a few more ideas and reviews from Hubspot: https://blog.hubspot.com/website/website-traffic-analysis-tools
Email Marketing Still Reigns: Are You Maximizing Your Efforts?
Email is a bit unique.
With email marketing, you’re meeting a more qualified audience ‘where they are’ by delivering to their inbox instead of them having to search for you.
Key points about email marketing:
- It’s highly customizable
- Your list is essentially pre-qualified
- It’s a repeatable process
- The CTR is less affected by 3rd party algorithms (in comparison to social media)
It’s important to build an email list. The reason most sales funnels start with a free ‘lead magnet’ is to get ideal clients on an email list.
99% of email users check their inbox every day, with some checking 20 times a day. Of those people, 58% of consumers check their email first thing in the morning.
(OptinMonster)
With email marketing, it’s recommended to watch open rates, click rates, and conversations. As your list builds and you send more messages, you should start to see trends around subject lines and topics that gain more traction.
Each industry has slightly different metrics and averages, but with a quick search you can find stats on what to expect for your own email marketing statistics.
Here’s an example of an industry averages chart from Constant Contact – https://knowledgebase.constantcontact.com/articles/KnowledgeBase/5409-average-industry-rates?lang=en_US#compare
Interesting note: Consulting services average a 20% email open rate with a 1% click rate.
The ABCs of Effective Advertising
Each advertising campaign should be driven by a goal that aligns with a short or long term goal of your business, and has clearly defined targets.
Some examples of goals are:
- views
- engagement
- registrations
- sales
Based on those goals, you can derive the data you want to watch and track.
However, the standards should still apply because you can’t get a sale without a click, and you can’t get a click without an impression. So, no matter the goal, we still watch the CPC, CTR, conversion rate, and ROI for each campaign. Watching each step in the process will help you identify any breakdowns and areas for improvement.
“Nobody counts the number of ads you run; they just remember the impression you make.”
— Bill Bernbach
Proactive Data Collection Offers Invaluable Insights
Collecting and monitoring reactive marketing data is extremely valuable.
Why? Because it’s the truth about your organization and products or services.
But what about proactive data? Yes, that’s an option, too.
For example, before you start an advertising campaign, it’s possible to gain some insight into what your expectations should be. Programs such as Uber Suggest can give you CPC estimates for keywords, and Google Search console can help you identify search volume.
Data collecting and monitoring can be time consuming and often feel overwhelming. The good news is that it is a process that can often be automated.
So once you set up your data collection channels and identify your key metrics, the process then becomes an interesting game of personal bests.
If you’re not a tech guru, we can guide and assist you each step of the way with our digital marketing expertise. Click here to set up a time to chat.